Although keeping charging stations running is foundational, performance management is about understanding utilization patterns to optimize pricing, identifying underperforming assets to guide capital allocation, ensuring consistent user experiences that drive loyalty, managing energy consumption to control costs, and ultimately maximizing return on infrastructure investment.
Whether you're operating public charging networks, managing fleet depot charging, or providing workplace charging, performance management transforms infrastructure from a cost center into a strategic asset.
TL;DR - Maximizing charging station performance
- Performance management encompasses 3 core dimensions: uptime, utilization and user experience
- Target benchmarks for high-performing networks: 97-99% uptime for public/fleet charging
- Five critical KPIs to track daily: availability percentage, average sessions per charger per day, energy throughput (kWh), session success rate, power delivery efficiency
Understanding Charging Station Performance
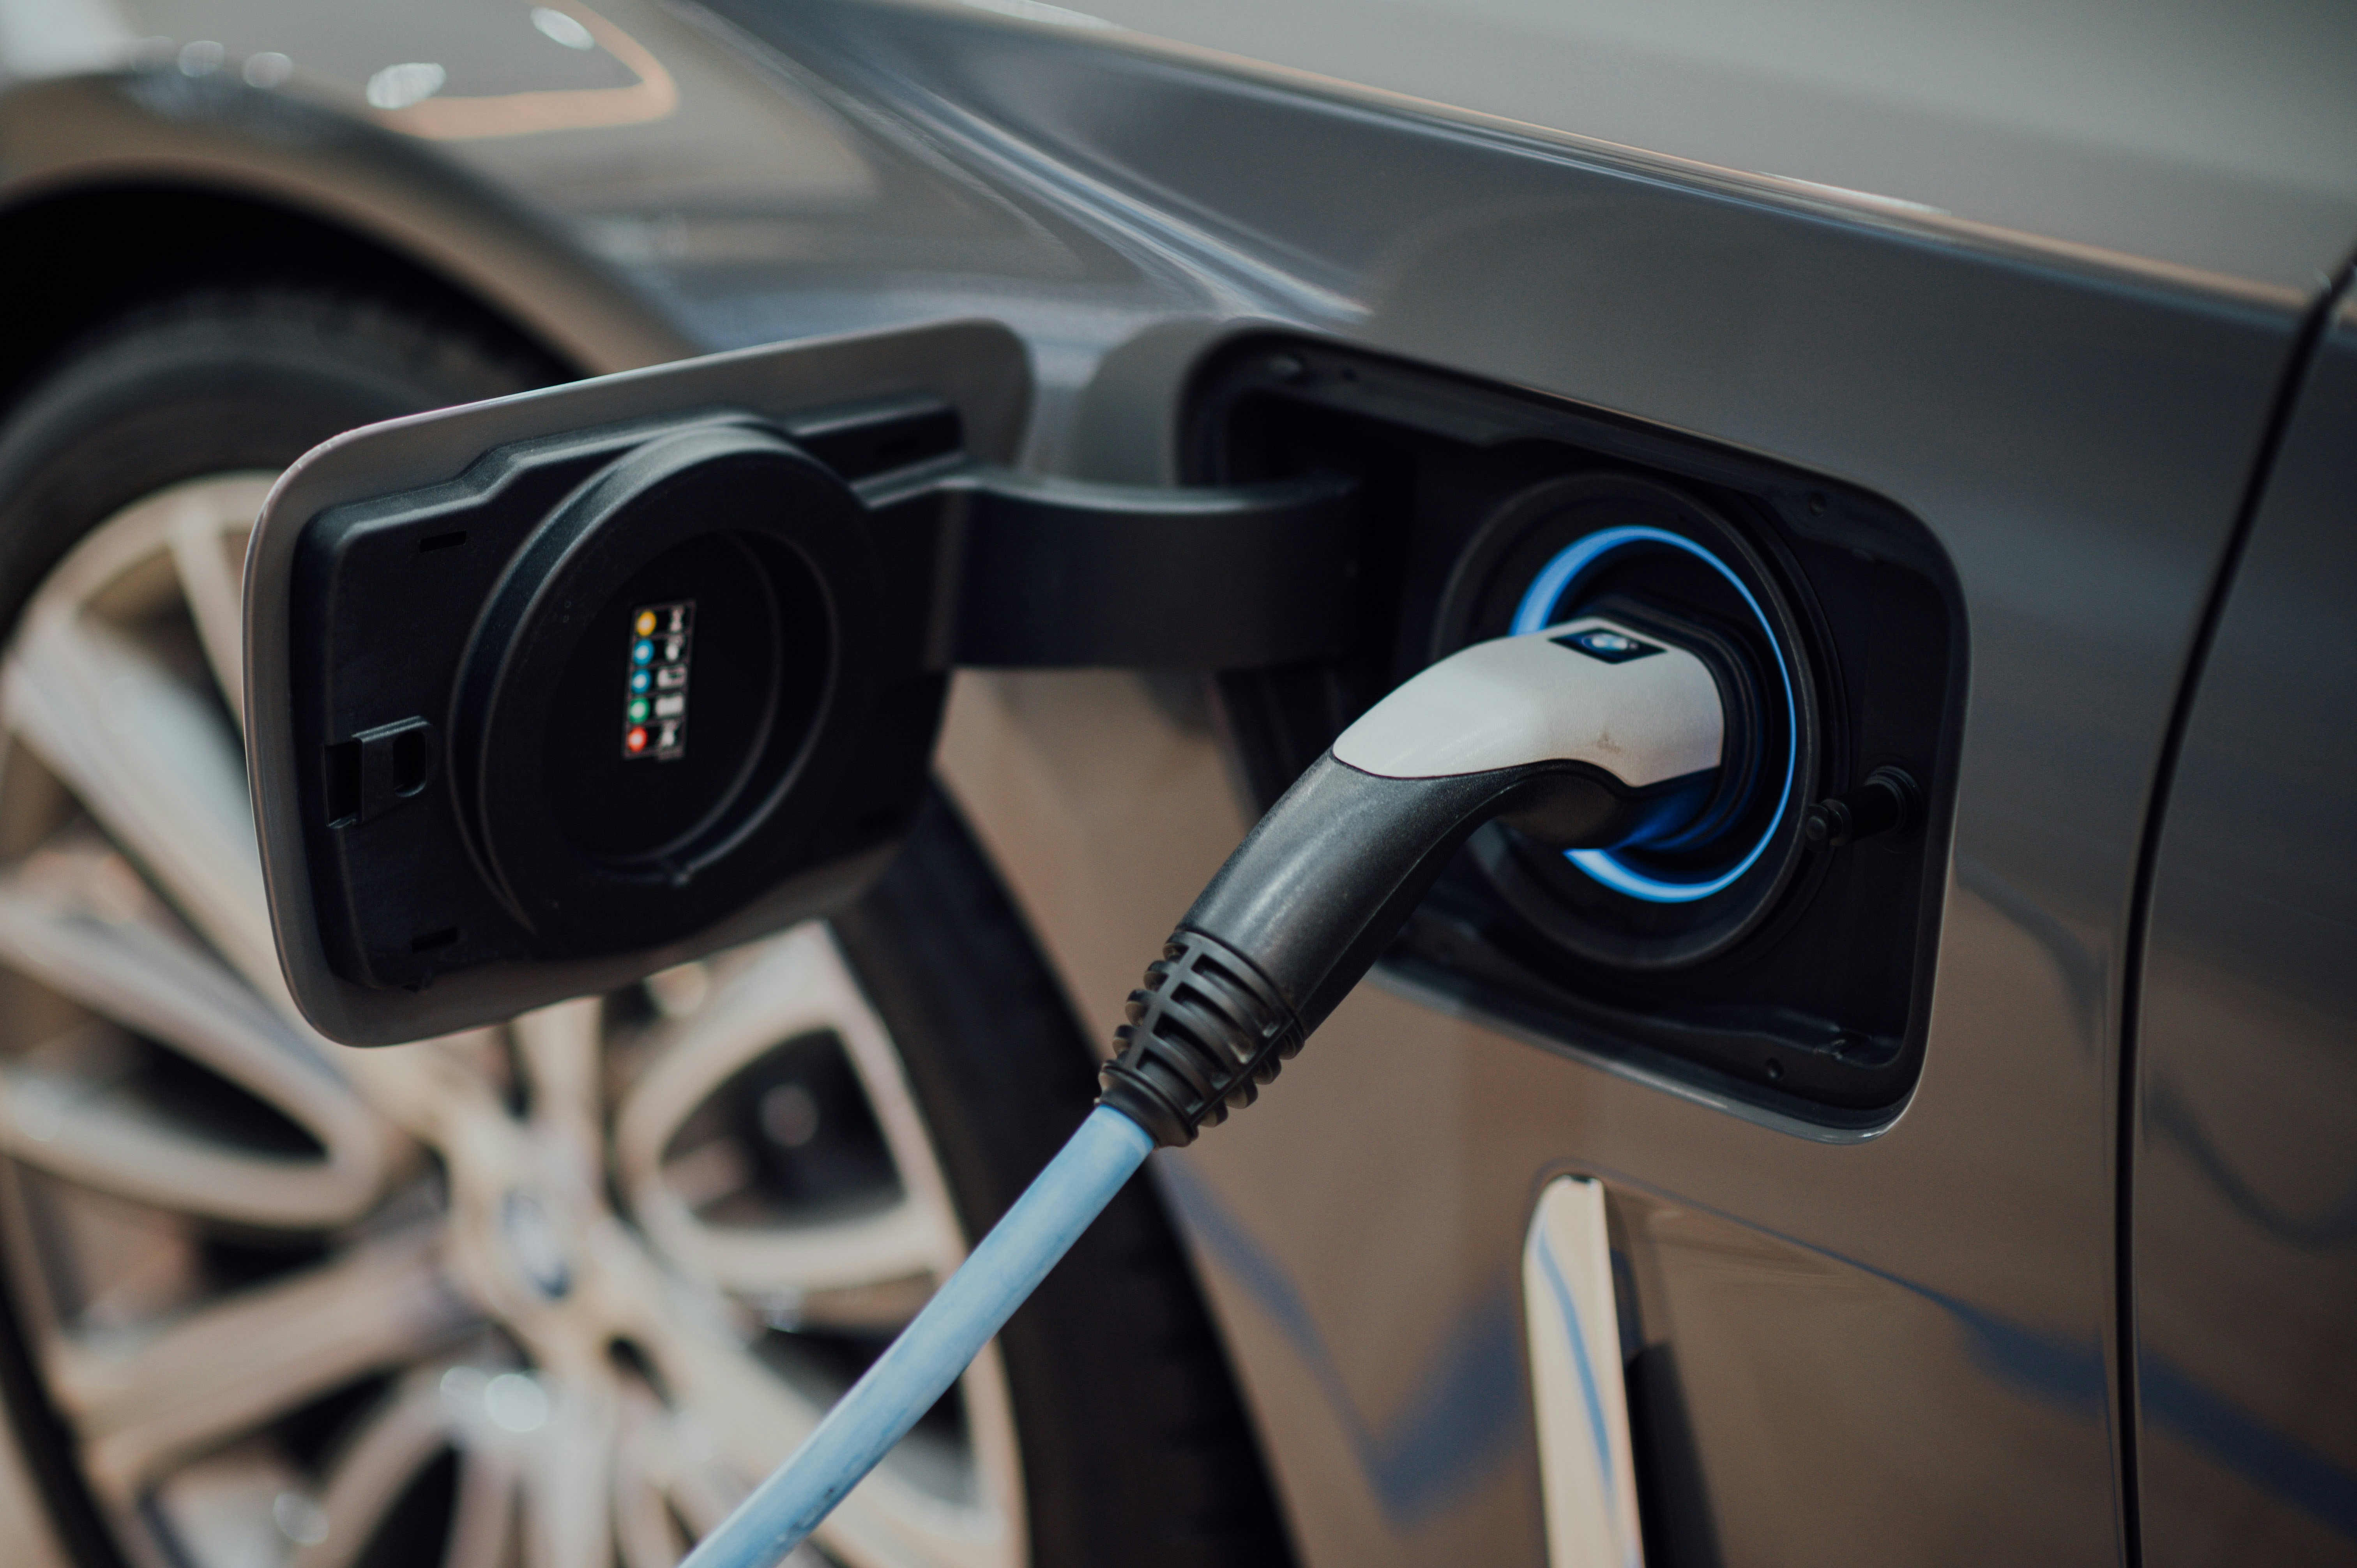
1) Uptime - Uptime is the single most visible measure of network reliability. High-performing operators consistently achieve 97-99% uptime. Uptime is not just about hardware health - it includes communications stability, payment and authentication systems, firmware compatibility, network connectivity, and power availability.
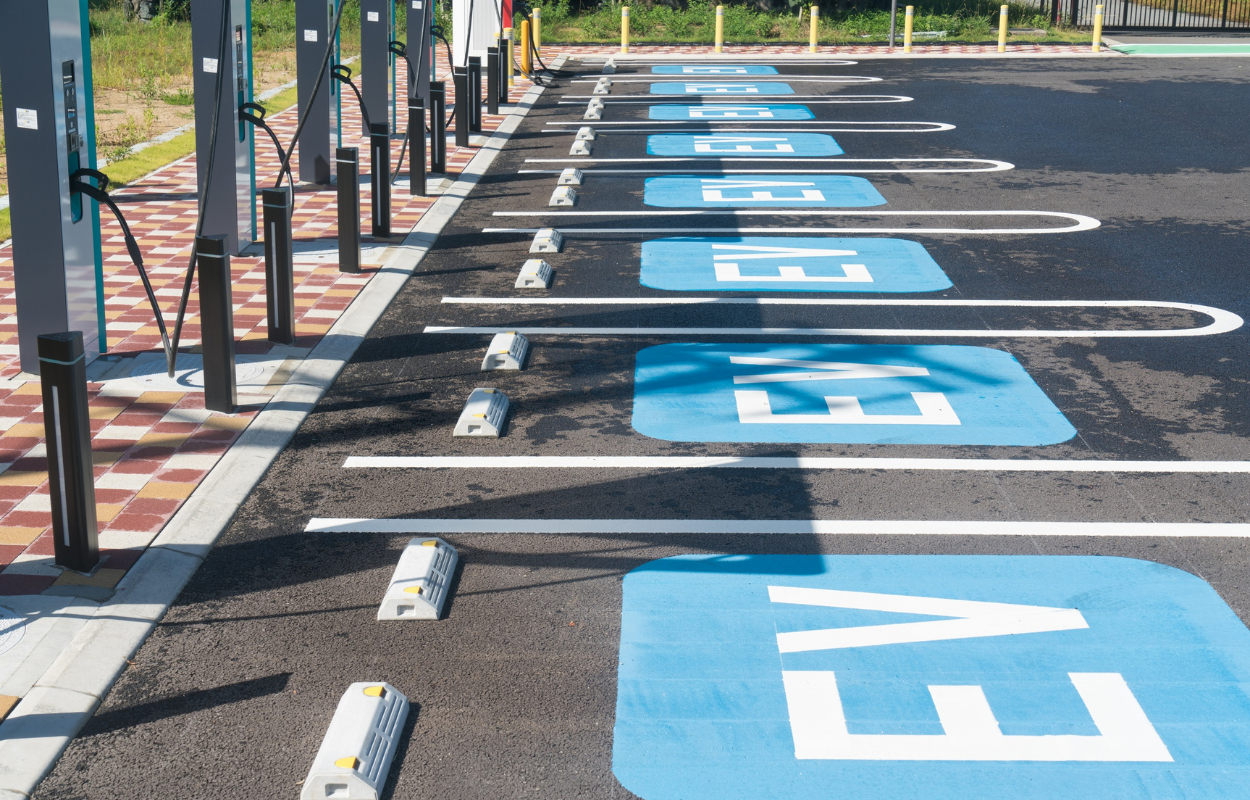
2) Utilization - Once chargers are functioning reliably, the next question is whether they are being used optimally. Utilization depends on charging speed, location and visibility, pricing strategy, and load distribution. Underutilized chargers represent locked capital. Overutilized chargers signal that you need to expand capacity.
3) User Experience - Even a highly available charger fails its purpose if users struggle to start a session, face error codes, or experience unpredictable charging speeds. Networks with a high session success rate above 95% consistently outperform competitors in customer loyalty and energy throughput.
The Five KPIs That Matter Most
1. Availability Percentage - This measures how often chargers are functional and ready for use, calculated per connector. A 97-99% benchmark may sound high, but even small drops can erode user trust quickly.
2. Average Sessions per Charger per Day - The clearest indicator of demand and utilization. Low sessions could indicate poor location, pricing misalignment, or hardware that doesn't meet driver requirements. High sessions signal strong demand and potential congestion.
3. Energy Throughput (kWh Delivered) - Your revenue driver, especially in public charging. Steady growth indicates healthy adoption; drops indicate potential performance problems.
4. Session Success Rate - Measures how many charging sessions start and complete without issues. Anything below 90-92% warrants investigation. Common causes include EV-CP non-communication, firmware mismatch, OCPP transaction errors, and payment processing failures.
5. Power Delivery Efficiency - Compares actual power output against rated capacity. Improving power delivery directly increases revenue and throughput.
FAQ
Q: What is considered good charger uptime? For public and fleet operations: 97-99% uptime is the industry benchmark.
Q: How often should I review utilization data? Weekly reviews enable quick adjustments; monthly reviews inform long-term planning.
Q: What impacts session success rate the most? Firmware mismatches, payment issues, and poor EV-charger communication.
Q: Can chargers be optimized after installation? Yes. Pricing, load distribution, firmware updates, and monitoring improvements all significantly boost performance.
Eigen Digital's charge management platform is designed to help operators combine real-time visibility, intelligent energy management, predictive fault detection, and seamless user experience features. Contact Eigen Digital for a consultation or demo today.